BY RENAUD ANJORAN
A few months ago we showed how the QC inspector job would get easier with the help of a mobile app.
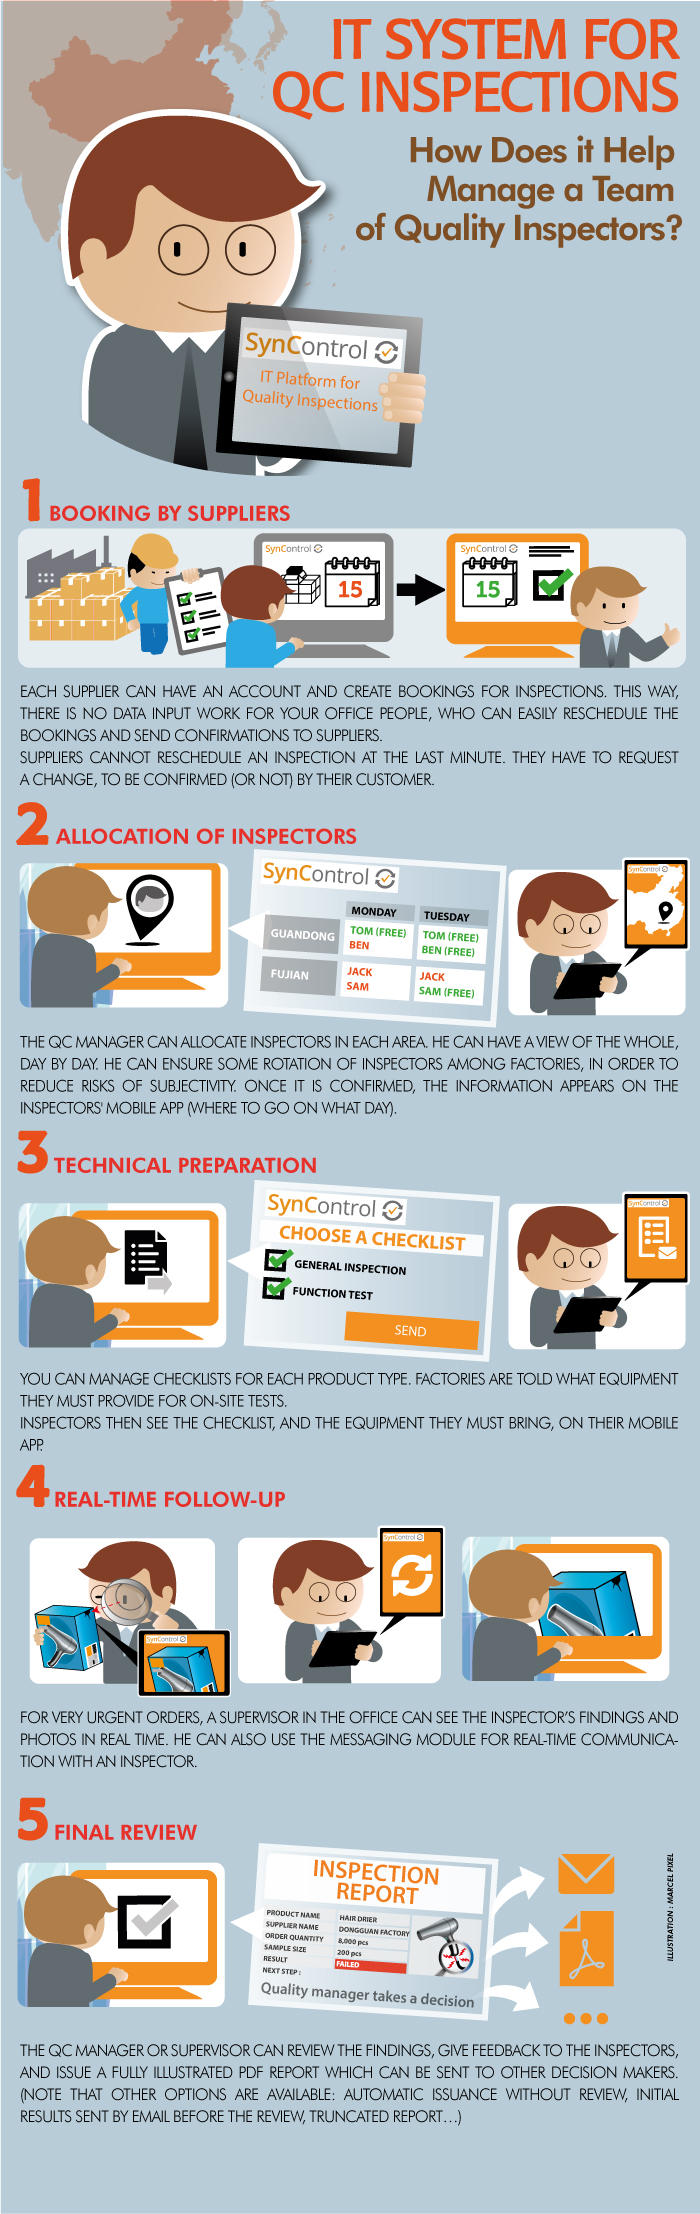
Today we want to show how the right technology will allow quality control departments to be better organized and to cut lead times.
There are several ways technology helps.
Streamlining the booking process
Most procurement offices exchange emails and phone calls with factories to confirm the dates of upcoming inspections. Then they update an Excel file and share it (more or less) among their team.
The most efficient is to link inspections to suppliers — in other words, to force them to book inspections. That’s what all big importers do, from my observations. If your suppliers are not cooperating, another solution is to pull the data directly from your ERP (or an IT solution that helps you
Optimizing the allocation of inspectors
What I saw in most quality departments is an Excel file that lists inspections (usually based on bookings from suppliers, as I wrote above). Inspectors are allocated based on their location and (usually) on their competencies.
Ideally the QC manager would assign inspectors with a view over their workload (spreading the work more evenly among the team). He would also ensure inspectors are rotated – this is important to keep all parties careful and on guard.
The solution is to give a clear dashboard that displays this information visually. It would require several pivot tables in an Excel sheet, so it is seldom done.
Assigning the right checklists and specifications
A common problem is poor dispatch of information among the team. Design & engineering changes are common, rendering many files obsolete. Chinese manufacturers seldom have good document control, hence the need to be very vigilant on recent changes in specifications.
A good IT system keeps track of changes in documents and ensure only the latest version is available to everybody. It also standardizes checklists and defect lists based on product types, for a gain both in efficiency and in reliability.
Communication between field staff and office staff
In my experience, phone calls to inspectors result in misunderstandings at least 10% of the time. Using Wechat is an improvement, but the ideal is for the office staff to be able to see what inspectors are doing in real time — to see the photos they have taken, the comments they have written, etc.
This is possible once inspections are done on a tablet, with real-time synchronization of data. Add to this a simple messaging system, and inspectors become much easier to manage from a distance.
‘AQL’ stands for ‘Acceptance Quality Limit’, and is defined as the “quality level that is the worst tolerable” in ISO 2859-1. It represents the maximum number of defective units, beyond which a batch is rejected. Importers usually set different AQLs for critical, major, and minor defects. Most Asian exporters are familiar with this type of setting.
For example: “I want no more than 1.5% defective items in the whole order quantity, on average over several production runs with that supplier” means the AQL is 1.5%.
The “AQL Tables”
The “AQL tables” are statistical tools at the disposal of buyers (for product inspections). They are an industry standard. Most suppliers involved in international trade are familiar with it.
They help determine two key elements:
How many samples should be picked and inspected, among a batch of product or parts?
Where is the limit between acceptability and refusal, when it comes to defective products?
(If you’d like to see how to use AQL tables, scroll down to the section “Getting familiar with the AQL tables” below.)
The need for an objective measurement of quality
In certain product categories, there will be defective products in virtually every production batch. It is often true even after the manufacturer has checked each individual product and has repaired the defective ones, since visual inspection is not 100% reliable.
Therefore, in many supplier/buyer relationships (particularly when the application does not result in life or death outcomes), the supplier is not expected to deliver defect-free goods. The buyer needs to control the quality of purchased goods, since he does not want too many defects. But what does “too many” mean?
How to set the limit between acceptability and refusal in a way that can be agreed upon and measured? This is what the AQL comes into play.
What is the AQL?
As I wrote above, the ‘AQL’ is the “quality level that is the worst tolerable” on average over a period covering a number of batches.
In practice, three types of defects are often distinguished. For most consumer goods, the limits are:
0% for critical defects (totally unacceptable: a user might get harmed, or regulations are not respected).
2.5% for major defects (these products would usually not be considered acceptable by the end user).
4.0% for minor defects (there is some departure from specifications, but most users would not mind it).
These proportions vary in function of the product and its market. Components used in building an airplane are subject to much lower AQL limits.
Note that this tool is used mostly during final outgoing inspections (when the products are ready to be shipped out), and sometimes during production (when the number of products is sufficient to have an idea of the batch’s average quality).
Getting familiar with the “AQL tables”, sometimes called “ANSI tables”
Before using the AQL tables, you should know three parameters:
The ‘lot size’. If you ordered different products, consider each product as a separate lot. (The quantity of each product is the lot size). If you ordered only one product, the lot size is the total batch quantity.
The inspection level. Different inspection levels will command different numbers of samples to inspect. In this article, we will stick to the so-called “level II” under “normal severity” and to single sampling plans.
The AQL limits appropriate for your market. If your customers accept very few defects, you might want to set a lower AQL for both major and minor defects.
Some specialized quality inspection software will show all the numbers automatically, but it is good to understand how to read the tables.
There are basically two tables. The first one tells you which ‘code letter’ to use. Then, the code letter will give you the sample size and the maximum numbers of defects that can be accepted. First table: sample size code letters
How to read this table? If you follow my example, I assume your ‘lot size’ is comprised between 3,201 pcs and 10,000 pcs, and that your inspection level is ‘II’. Consequently, the code letter is “L”. Second table: single sampling plans for level II inspection (normal severity) How to read this table? Your code letter is “L”, so you will have to draw 200 pcs randomly from the total lot size. Besides, I assume you have set your AQL at 2.5% for major defects and 4.0% for minor defects. Therefore, here are the limits: the products are accepted if NO MORE than 10 products with major defects AND NO MORE than 14 products with minor defects are found. For example, if you find 15 products with major defects and 12 products with minor defects, the products are refused. If you find 3 with major defects and 7 with minor defects, they are accepted.
Note: in quality inspections, the number of defective products is only one of the criteria. It is sometimes called “quality”, or “quality findings”. The other criteria are usually on the inspector’s checklist, which typically includes:
Product conformity (aspect, workmanship…). If all the products are in red color instead of orange, there is no need to count each sample as a defect. It makes more sense to refuse for product conformity.
Specific tests defined in the inspection checklist (they might not be performed on all inspected samples if they are time-consuming or destructive).
Special case: the AQL in the Codex standard stan233
There is another widely-used standard for food products. It calls for taking a much smaller sample (which make sense since opening a food product’s packaging means destroying it).
The general approach is the same, from what I saw, with some differences (e.g. the tables are different depending on the net weight of a unit of product).
Frequently Asked Questions about AQL
Q: So, basically I have to authorize the factory to produce some defects?
A: In theory no. That’s why the AQL was renamed, from “acceptable quality level” to “acceptance quality limit”. It is a “limit” (and a loose one at that).
Here is what the ISO 2859 standard says:
“Although individual lots with quality as bad as the acceptance quality limit may be accepted with fairly high probability, the designation of an acceptance quality limit does not suggest that this is a desirable quality level. Sampling schemes […] are designed to encourage suppliers to have process averages consistently better than the AQL.”
Note that, in practice, using these statistics means you assume the factory cannot reasonably be expected to turn out 100% good quality.
Alternatively, you can choose an “acceptance on zero” plan. As soon as one defect is found, the inspection is failed. But you can impose this to suppliers only in situations where quality requirements are very high (in the auto industry, in aerospace…).
Q: As a buyer, should I charge back the value of the defective products to the manufacturer?
This is not standard practice. The standard practice is actually to charge nothing back, as long as the inspection is passed.
However, as the buyer, make sure to add this provision in your contract with the supplier: if an inspection is failed, the supplier has to sort & rework the goods, and submit them to a new inspection (and the re-inspection costs are charged back to them).
Q: Based on my AQL, I calculated the proportion of defects authorized. Why don’t they correspond to the maximum number of defects authorized?
A: It is true. In our example above, 2.5% of 200 samples is 5 samples, but we accept the goods even if 10 samples are found with a major defect.
Why this difference? There are heavy statistics behind this issue. To keep it simple, the producer’s risk is his risk of rejection (based on the random element when drawing the sample) even though his products (if they were all checked) would be accepted. That risk is about 5% in this standard. And, along the same logic, there is a consumer’s risk and is is around 10%. As you can see, this standard is favorable to the producer’s side.
Q: Why not just say, ‘we’ll check 10% of the quantity’, or whatever percentage deemed appropriate?
A: this is discouraged, as clause 4.3.3 of the ISO 2859-10 standard explains:
Ad hoc sampling should not be used because it will lead to unknown risks that may be too high. Furthermore, there is no formal basis for either the acceptance or non-acceptance of the lot. Examples of ad hoc sampling include sampling of a fixed percentage of a lot or a convenience sample taken at haphazard times.
And here is one thing many buyers don’t realize. They say “inspect 10%”. But, as we go up in the total quantity, the proportion of products checked can decrease, for the same confidence in the inspection results.
As you can see in the chart below, if you follow the AQL tables, the number of samples to check (vertical axis) increases at a slower pace than the total quantity (horizontal axis).
Q: How to choose an AQL limit for my products?
A: I explained it in details in this article. It depends on your distribution channel and your product’s end use. Note that your supplier might refuse AQL limits they estimate as too tight (i.e. too low).
Q: Do we have to follow levels I, II, III, etc. and AQLs 1.0, 1.5, 2.5, etc.?
No. They are mere parameters that were thought to be applicable to most situations. For the sake of simplicity, it is better to have 3 tables with 10-20 columns each, than 50 tables with 100 columns each. Remember, all this was computed by hand in the 1930s, and inspectors had to look up the tables in paper form.
If you have a statistical software package such as Minitab, you can adjust the parameters as you see fit.
Q: What are the “reduced” and “tightened” severities?
A: They are designed to be used in very specific situations, when a producer is particularly reliable, or on the contrary fails too often.
In practice, these severities are seldom used. Most inspections are done in normal severity. The rules to switch from normal to reduced or tightened are considered an important part of the standard (actually the evolutions of these rules constituted the main changes from MIL-STD 105A and MIL-STD 105E) but can be ignored.
Jim Bossert wrote this in the Feb. 2016 issue of Quality Progress:
You can use any plan without using the switching rules, but you do run the risk of not meeting the alpha risk in the end. These plans were developed to be used, as documented.
A normal plan is generally used and the switching rules come in when the clearance number has been obtained.
Some processes may never switch. If you choose a plan that is tightened or reduced to start with, you potentially will either spend too much on inspection (tightened) or risk having a bad product go to the customer (reduced).
It is a business decision for you to make if your customer is not demanding it. The switching rules are there to protect the producer when the product is running well or it has problems.
Q: What are the limits of a quality control approach based on random sampling and AQL limits?
A: There are several limits:
1. An AQL limit is a target rather than a maximum. The buyer might have a nasty surprise when receiving a batch of products that “passed” the inspection.
2. A statistical QC approach does nothing to reduce the defects in the first place.
Q: Can’t I just do my own sampling plan?
Sure. If you have a math background, you know that you’ll need to use a hypergeometric distribution (since samples are taken from the lot at random, are checked, and not put back into the lot until the end of the inspection). Specialized software like Minitab can help you a lot here.
If you want to avoid statistics altogether, your limits on the numbers of defects will not make much sense, but they might “feel” right intuitively and it might make you more comfortable… Just be aware of their shortcomings.
Make sure you get the supplier’s agreement on your plan. This might be the hardest thing to achieve!
Q: Is there a more efficient way of checking quality of finished products?
There are many ways of drawing samples and checking their quality.
If you don’t mind a more dynamic inspection plan, where the number of samples to check can’t be predicted in advance, you might want to follow a multiple-sampling plan, or even a sequential sampling plan. On average, for the same confidence in the decision, fewer samples will need to be checked.
Q: Where can I learn more about the AQL?
If you really want to understand the concept of the AQL, you should spend about 20 minutes (total) watching these 3 videos on Youtube.
BY RENAUD ANJORAN
If an inspector controls the quality of your products in China, he probably checks only a portion of the whole batch.
But how does he decide how many pieces to pick for his inspection? In other words, what sampling plan does he follow?
The most commonly used is the single-stage sampling plan by attributes.
What does it mean, and what are the other options?
A “single-stage sampling plan” dictates that a certain number of pieces (n) should be drawn and inspected. That number n depends mainly on the size of the batch (and also on the inspection level). If the number of defects is under the AQL limit, the result is passed.
In a “double-stage sampling plan“, the inspector would start by taking a smaller number of sample (n1). If the number of defects in n1 is above certain limits, more samples are picked.
An “accept on zero” plan is a weird animal that is usually not a good idea in China. Some importers, who are sensitive to legal litigation by their customers, accept batches only if no defective unit is found. The only advantage is the fewer samples need to be checked.
A “sampling plan by attributes” classifies the samples as either “non defective” or “defective”. There is nothing in between.
A “sampling plan by variables” allows for a finer evaluation. For example, the length of the product is measured, and the exact findings are taken into account when a decision is made.
A “rectifying sampling plan” is applicable if the defects that are found can be corrected immediately. It is not very different from a sampling plan by attributes, but it takes into account that the batch is of higher quality after the inspection… and, in case of inspection failure, the whole batch should be inspected.
“Continuous sampling” is the best plan when products are made individually in a continuous flow. It makes no sense to pick samples inside each “batch”. It consists of several phases:
At the beginning, each piece is checked (that’s the “screening”).
After a certain number of pieces were found satisfactory, only certain pieces are checked randomly (that’s the “sampling”).
If a piece is defective: back to screening.
—–
If you want to use one of these plans, you should visit the excellent SQC Online website and get the numbers you will need.
And if you want more in-depth information about these plans, you should read Practical Acceptance Sampling: A Hands-On Guide. It was pointed out to me a few months back by Etienne Charlier.
I pasted this book’s description (from the publisher) below. I should add that it is a college textbook first, before being a practitioner’s guide.
Acceptance sampling plans provide criteria and decision rules for determining whether to accept or reject a batch based on a sample. They are therefore widely used by manufacturers, suppliers, contractors and subcontractors, and service providers in a wide range of industries.
The book introduces readers to the most popular sampling plans, including Military Standards and civilian ISO and ANSI/ASQC/BS standards. It covers the design, choice and performance evaluation of different types of plans, including single- and double-stage plans, rectifying and non-rectifying plans, plans for pass/fail and continuous measurements, continuous sampling plans, and more.
BY RENAUD ANJORAN
This article introduces the different options available to buyers, when it comes to the representativity of inspection findings.
Inspection level II (under “normal severity”) is appropriate for most inspections. But it is sometimes necessary to increase–or or reduce–the number of samples to check.
The need for sampling, rather than 100% checking
When controlling the quality of a batch of products, it is not practical to inspect 100% of them (unless the quantity is very small). Inspecting a large number of products takes a long time: it is expensive, and inspectors are less effective as they get tired. Actually, a 100% check does not yield that much more information than inspecting a statistically representative sample.
The question becomes: how many products to check?
Why different inspection levels?
There is a fairly obvious principle in statistical quality control: the greater the order quantity, the higher the number of samples to check.
But should the number of samples ONLY depend on the order quantity? What if this factory had many quality problems recently, and you suspect there are many defects? In this case, you might want more products to be checked.
On the other hand, if an inspection requires tests that end up in product destruction, shouldn’t the sample size be drastically reduced? And if the quality issues are always present on all the products of a given batch (for reasons inherent to processes at work), why not check only a few samples?
For these reasons, different levels are proposed by MIL-STD 105 E (the widely recognized standard for statistical quality control).
It is usually the buyer’s responsibility to choose the inspection level–more samples to check means more chances to reject bad products when they are bad, but it also means more days (and dollars) spent in inspection.
The 3 “general” inspection levels
Level I
Has this supplier passed most previous inspections? Do you feel confident in their products quality? Instead of doing no quality control, buyers can check less samples by opting for a level-I inspection.
However, settling on this level by default, in order to spend less time/money on inspections, is very risky. The likelihood of finding quality problems is lower than generally recommended. Level II
It is the most widely used inspection level, to be used by default. Level III
If a supplier recently had quality problems, this level is appropriate. More samples are inspected, and a batch of products will (most probably) be rejected if it is below the quality criteria defined by the buyer.
Some buyers opt for level-III inspections for high-value products. It can also be interesting for small quantities, where the inspection would take only one day whatever the level chosen.
The 4 “special” inspection levels
These special levels can be applied in cases where only very few samples can be checked. “Four additional special levels, S-1, S-2, S-3 and S-4 […] may be used where relatively small sample sizes are necessary and larger sampling risks can be tolerated” (ISO 2859 standard).
Under S-3 level, the number of samples to check is lower than under S-4, and so on.
In practice: for consumer goods, quality control is usually performed under the general levels.
The special levels are used only for certain tests that either take lots of time or destroy the samples. Another situation where special levels are appropriate is a container-loading supervision–to have an idea of what is inside the cartons, without spending too much time at that checking.
Two examples to get an clearer understanding
Let’s say you have ordered 5,000 pcs of a product. In the table below, you can see how many samples would be drawn under each of the 7 inspection levels.
General inspection levels
Special inspection levels
I
II
III
S-1
S-2
S-3
S-4
80pcs
200pcs
315pcs
5pcs
8pcs
20pcs
32pcs
As you can see, the numbers of samples to check vary from 5pcs to 315pcs. But a trained inspector might be able to do it in one day, whatever the inspection level you choose.
Now let’s say you have ordered 40,000pcs of a product. Again, you can see the differences in sample sizes.
General inspection levels
Special inspection levels
I
II
III
S-1
S-2
S-3
S-4
200pcs
500pcs
800pcs
8pcs
13pcs
32pcs
80pcs
In this case, the inspection might take one day of work (for S-1, S-2, S-3, S-4, or reduced level), two days (under level II), or three days (under level III).
BY RENAUD ANJORAN
A few weeks ago, Jean-Etienne Alain, deputy director of Canal Toys Asia, was a speaker in an EU Chamber of Commerce in China seminar. He explained the way his company managed to optimize the laboratory testing process.
I found it very interesting, so I took some notes that I am reproducing below. His company sell toys, mainly into the European Union, that are made in China.
Here are the challenges they are facing:
Many laboratory tests are necessary to make sure the EN71 directive is respected. It amounts to a lot of money.
They need to respect very strict color requirements from the licensors (Disney and such).
They work with many factories in several areas of China, so controlling colors is very hard.
Here is the solution they found:
They decide what colors will be used before all the designs of a new season are confirmed. They reduce the number of colors as much as possible.
They buy all the components themselves, to maximize control over the supply chain.
They launch “testing campaigns” for all the components to be used. Even if a component is to be used in several production across several factories, it is tested only once.
It allows Canal Toys to enjoy the following benefits:
More control over the supply chain.
Lower testing costs through consolidation.
They buy the components earlier and they start the injection molding process before the peak season of May and June (the toy business is very seasonal because of Christmas sales). It means prices are markedly lower.
Some testing is still necessary in production, but only on the components that could not be tested prior to production.
Obviously they need a substantial team on the ground to coordinate all this, but it allows them to have more control and (probably) lower costs than many competitors.
Anybody has other tips for optimizing lab testing? What do you think?
How can we lower costs, while maintaining the highest standards of quality inspections?
SynControl’s new presentation: “22 Ways To Cut Costs On Your Quality Inspections” uncovers these cost savings, and is applicable to all kinds of manufacturers, from garments to mechanical products, and from decorative items to electronics.
What you’ll learn in this presentation
Quality managers and general managers will discover 22 ideas they may have overlooked until now, which explore how to lower product inspection costs, and in which situations they’re applicable, including:
Critical-to-quality checkpoints
Tweaks to the settings of industry standards (lower level, reduced severity, skip-lot schemes) and even going off-standard while controlling risks (with precise instructions)
How to optimize the inspection of many SKUs, with clear examples
How to automate quality inspection reports
Renting your own inspection center’s benefits
How and why to set up small teams that include merchandisers/purchasers and inspectors
Why flexibility can be gained by having inspectors do other jobs and/or hiring external resources
Improved training factory inspectors and getting their reports
Skipping parts of an inspection in order to save time
Applying penalties for failed inspections, or even third-party containment
How to set up a supplier management system that gives suppliers incentives to improve
Getting suppliers to implement corrective actions and/or better process controls
How to use favorable payment terms to reduce inspection frequency
…and many more useful ideas
If you’re interested in how to lower product inspection costs of products which are made in China, download this presentation for free by filling out the form on this page and hitting 'download presentation.'
Article Source: syncontrol
BY RENAUD ANJORAN
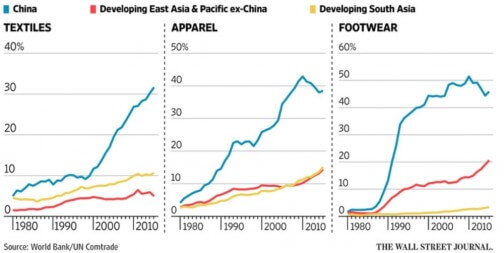
There have been a couple of interesting articles about future trends in China manufacturing.
Dan Harris on the China Law Blog pointed to a well-researched WSJ article (How China Is Changing Its Manufacturing Strategy — It hopes to keep low-cost factories and attract high-end ones).
The author argues that manufacturers of low-cost, low-complexity items have, for the most part, not disappeared in China.
The central government is concerned about losses of low-end manufacturers to other countries and so is giving them incentives to move to lower-cost parts of China. But at the same time, it wants to raise wages and spur consumer demand by developing more high-tech manufacturing, such as semiconductors and robotics.
How did China keep its “cheap” factories open?
China has managed to hold on to low-end industry far longer than its Asian neighbors at a similar stage of development. Government incentives, subsidies, the large domestic market and good infrastructure that encourage companies to remain onshore all play a part, says World Bank economist Karlis Smits.
At the same time, China is actively preparing the next cohort of manufacturers… Those that make much more use of new technologies.
China is pushing its companies to automate, boost research budgets and make more higher-value products. It has also encouraged companies to acquire European and U.S. rivals with advanced technology. Beijing has targeted 7% annual growth for manufacturing and a 15% jump in corporate investment to support industrial upgrades between now and 2018.
On his side, Fredrik Grönkvist on ChinaImportal points to the fact that the strong changes most people expected haven’t happened.
A couple of years ago, the talk was all about how Chinese suppliers would depart from the east coast and head in droves to the inland. That didn’t happen.
Instead, China’s East Coast grew into an even stronger manufacturing base. Shenzhen is the brightest shining star, and has cemented its position as the World’s center for manufacturing.
To me, that was rather expected. Shenzhen has today grown into an ecosystem that cannot be simply transplanted.
He doesn’t think other Asian countries will steal much market share from China.
In the medium to long run, China will lose its cost advantage entirely, compared to the US, EU and Japan, due to cheap robotics, AI and 3D printing. But that’s at least two or three decades away.
Fredrik also believes manufacturing is becoming increasingly accessible – even to the smallest business.
Chinese suppliers are OEMs. Essentially, they are ‘Open Source Manufacturers’.
Chinese suppliers don’t care who you are, or what you sort of background you have. All they are interested in is your business.
Getting on-the-ground information and support services is also becoming easier for importers.
Until recently, international trade has been stuck in the past. Alibaba and Global Sources took suppliers online, but that didn’t solve every problem facing importers.
That is about to change, though, as supply chains come digitally. An entire ecosystem is coming into place, for companies of all sizes.
Today, a product can get financing on Kickstarter. Then, Alibaba comes in with their Trade Assurance program to secure the transaction with the supplier.
Once ready for shipment, just book a quality control online, and get a free shipping quote from Flexport – directly delivered to an Amazon FBA warehouse.
Even compliance to the importing countries’ standards is becoming easier to manage. Fredrik gives this example (valid for European importers):
Just buy a requirements list on ProductIP.com, and test your product for free using your Scio Pocket Molecular Sensor. The latter must be seen to be believed.
This is correct, for the most part. Many things are about to change when it comes to quality inspections/testing. I read recently about an odor and taste recognition device (NeOse). Actually a dedicated device is sometimes not required — for example a standard phone’s camera can recognize the microstructure of a seal (with Cypheme’s system).
BY RENAUD ANJORAN
This is the second part of the presentation I gave a group of Chinese suppliers. The first part, about the initial sourcing phase, is here.
I made a list of the most common ways foreign buyers are cheated in China. My message was, basically: “When a buyer feels cheated, he will try hard to find another supplier. Be very careful.”
1. Price increases after a deposit is transferred
The supplier quotes a price, gets an order and a cash deposit, and then tell the buyer the price has increased. Usually a reason is invoked (materials just got more expensive, the product takes longer than expected to produce…).
And, if the buyer asks for reimbursement of his deposit, it is denied because “it was already used for purchasing the materials for your production”.
It is perceived as very dishonest. Sure, quotation mistakes happen. But, when costs are under-evaluated, it should be at the supplier’s expense (just like the opposite is at the supplier’s benefit).
My advice to suppliers is to ask for the deposit “to pay a cash advance to material suppliers, and to ensure prices don’t go up”. And then, never ever increase prices after a deposit is wired — except if the buyer changes some requirements.
2. Price increases from one order to the next, without relation to production cost increases
Let’s say the RMB/USD rate suddenly raises by 20%. Importers will not be shocked if you raise your prices (expressed in USD) for future orders.
Now, let’s say the product in question is made out of plastic, and oil prices suddenly go up 20%. If the supplier increases the final product by 20%, he is actually widening his profit margin. The oil cost is well below 100% of his total production cost, let alone his selling price.
In most cases, suppliers simply say “material costs go up, and labor costs go up, and the exchange rate goes up, so the new price is XX USD”. They do not want to give more data that could allow the buyer to challenge their calculations.
Importers see this lack of transparency with great suspicion. It is not as bad as a price increase after a deposit is received, but it can make a purchaser feel cheated.
Here is my advice to suppliers:
Back it up with objective data.
Don’t announce it once the buyer tells you a new order is coming up. Send revised prices every month, for example.
Offer alternative solutions (e.g. substituting a cheaper material) in case the new price is not acceptable.
3. Lack of reliability: late deliveries, inconsistent communication…
Here are a few manifestations of poor reliability that are very upsetting to buyers:
Shipment delays announced at the last minute, even though production managers could see it coming 2 or 3 weeks before.
Consistent over-optimism, which means consistent disappointment on the buyer’s side.
Lack of respect of contracts in general.
My advice to suppliers is to keep the customer updated along the production cycle. Share information quickly if there are problems, and show that you are hard at work trying to fix them.
4. Inability/unwillingness to reach the desired quality standard
Some importers are flexible with quality. Give them a discount when you mess up, and the business relationship is maintained.
Others are not (if quality is below a certain standard, products CANNOT BE SOLD AT ALL in their distribution channel).
My advice to suppliers is to evaluate each buyer’s quality standard. Sometimes it is obvious: “we sell these parts to Honda” or “it will be distributed as medical supplies in US hospitals” really means “if you mess up, we won’t take the goods”.
5. Non-respect of IP rights
For example, an importer asks two Chinese manufacturers to develop a new design. But only one gets the order. Here are two ways this can go wrong:
The manufacturer that gets the order might try to produce the same design and sell it to other customers.
The other manufacturer feels that he can do what he wants with the design. Since he did the hard work of developing prototypes, he will try to make money out of them through sales to other customers.
These attitudes are perceived as very dishonest by buyers. In case famous brands are counterfeited this way, there are many risks — including for the supplier, as Steve Dickinson from Harris & Moure explained to the same group of suppliers just before it was my turn to speak.
My advice to suppliers is to respect your customers’ intellectual property rights. Not respecting them is like stealing money in someone else’s wallet.
Now, some importers are more accommodating. Sometimes, a European buyer doesn’t mind if you sell the same designs outside of Europe. If that’s necessary to make the supplier happy with small orders at a low price, it might be acceptable to the buyer. But be open about it!
6. Lack of transparency
The two most frequent cases where lack of transparency hurts the importer are as follows:
Subcontracting production in a small workshop in order to cut costs (and without regard to quality requirements);
Changing a component, a packaging accessory, or a process step.
At least 95% of the time, the importer is not informed.
It is perceived as dishonest if discovered after the fact. But many importers don’t mind, if it is brought up the right way and if explanations are reasonable. For example: “we are very full, so we need to place production in another workshop if you really need us to respect this shipment date”.
My advice to suppliers is to avoid this as much as possible, and to do it for the right reasons (e.g. insufficient capacity, rather than cost savings).
—
I didn’t include outright scams (when the supplier stops communicating after a deposit is wired) in this list. I focused on what can go wrong when a business relationship is already in place.
What do you think?
BY RENAUD ANJORAN
Importers are often stuck between a rock and a hard place. They are asked by customers or by regulators to comply with very tough (and sometimes unrealistic) standards, and at the same time they need to ensure business continuity — keep selling similar products and make a margin.
This is quite common when a retailer sets very tough standards for social compliance. For example, Walmart writes that they will terminate any business relationship if they find out production was subcontracted to an unauthorized factory. They know it is extremely common in their supply chain, and yet they adopt a hard line.
This is also at play when a country wants all batches within a certain product category to comply with a safety standard. I don’t want to mention the exact case a client brought up to my attention recently, but make up an imaginary example that will drive my point just as well.
Let’s say Australia wants no metal product to rust when it comes to certain applications, and yet many products are still made with metals that can’t be treated not to rust. (Again, I am making stuff up here.) Everybody keeps selling and hoping they don’t get caught.
In these cases, what is the very worst thing that can happen? Having a bad case noticed by the customer/regulator, and being blamed for negligence after an investigation.
And what is a good way of not avoiding it? It is a three-step process:
Planning — what exactly are the requirements, and what are the risks in the current operations? Break down the risk in different categories.
Mitigating risks — do something for the highest risks, and (if possible) set some targets for improvement in the future.
Documenting and communicating — make sure there is a paper trail that can be audited, and (if appropriate) be proactive in communicating about your plan with the customer/regulator.
Let’s look into a couple of examples. Example 1: unauthorized subcontracting
The 3 steps could look like this:
Planning: collect data about each factory’s capacity per week; communicate to the customer how many weeks each production batch will take; get a written letter from each factory that they understand the requirement.
Mitigating risks: hold pre-production meetings at the factory before each production run and do basic maths to confirm capacity will be sufficient; send inspectors to the factory during production to confirm they work on the right product and to check production status.
Documenting and communicating: keep written traces of the PP meetings, the inspections, etc.
Example 2: tough safety standard — “metal products that never rust”
In this case, we could have:
Planning: place your current metal products in 3 buckets (red, orange, green)
Mitigating risks: get all your suppliers to sign a letter that confirms their awareness of this requirement; plan for testing 5% of “green” batches and 30% of “orange” batches; add a label for users of the red products that metal might show signs of rust.
Documenting and communicating: get all your test reports archived and sum them up in an Excel table. Show trends on a few KPIs.
—
Obviously, there are many possible approaches to this issue. These are just examples, but the overall idea (setting up a program that analyzes and addresses risks in an intelligent manner) worked well for a number of importers.
I left out the work with suppliers. Often, they have to make changes to the way they work, to the materials they purchase, and so on. This can also be a serious challenge.
Have you had similar experiences? Have you found another approach that works well?
Filed Under: Ethical Sourcing
BY RENAUD ANJORAN
Over the past couple of years, I noticed some very interesting comments on some articles on this blog. They came from Brad Pritts, a consulting engineer and six sigma black belt who works primarily in the auto industry.
I asked Brad a question to get more familiar with his industry, and he was kind enough to give me a detailed response. I thought it was too good to keep in my email inbox, so I reproduced it below with his permission.
The “Core Tools”
The North American auto industry created a series of what they call “core tools” – most of which might better be considered procedures or forms. The Control Plan
In my view the single critical item is the “[Quality] Control Plan”, which documents the production process flow, along with the QA/QC activities performed. As you can imagine these get involved when a more complex product is produced, but the individual steps are simple: Identify the process, and define the QA product and process controls: what is checked, how often, using what methods, and how is it recorded.
Here is a partial example of control plan for 1 product (click to enlarge):
There are several supporting “core tools”, including: Failure Mode Effects Analysis
This is a formal method for analyzing the production process (or, less frequently, a product design) for possible failures and developing countermeasures. Statistical Process Control
Standard QA SPC techniques, applied to automotive situations. Measurement System Analysis
A formal statistical method for comparing the measurement instrument capability to the products and tolerances of a specific product, in order to assure that the inspection is reliable.
The most frequent type of MSA is also known as a Gage Repeatability and Reproducibility study; this involves having several inspectors using the inspection gages to repeatedly check a small sample of products. Once this is done, the results are studied to see how the measurements vary. MSAs must be done for every checking gage or instrument used on the Control Plan. Production Part Approval Process (PPAP)
This procedure demands that the supplier use all of the above “core tools” in launching a product; run an initial mass production run (300 piece min); inspect a small number of random samples thoroughly; document the results; and keep the production process stable, getting prior approval before changing suppliers, adding tooling, etc.
Applying these tools with Chinese manufacturers
I find that with my suppliers, most can develop a control plan without too much difficulty; but consistent implementation is a different matter. I do control plan based process audits with every supplier, every visit, and look for process improvements while I’m at it.
They also have trouble understanding the philosophy of the Production Part Approval Process – that is, that we will not accept based on a few samples, but will insist on samples taken from mass production.
They also think that we are strict on demanding PPAP updates when they change a tool, a sub-supplier, or other important aspect of the process. We have had good luck with our supply base over the years, but also a degree of attrition from those who wouldn’t follow the disciplines.
The producer-price index fell 0.1% in December from a month earlier, the first decline since August 2016
[caption id="attachment_372" align="aligncenter" width="809"] A worker loaded spools of thread in a factory in Yadkinville, N.C. PHOTO: CHUCK BURTON/ASSOCIATED PRESS[/caption]
ducer-price index fell 0.1% in December from a month earlier, the first decline since August 2016
A worker loaded spools of thread in a factory in Yadkinville, N.C.PHOTO: CHUCK BURTON/ASSOCIATED PRESS
By
Josh Mitchell Jan. 11, 2018 10:43 a.m. ET
WASHINGTON—U.S. producer prices fell in December for the first time in more than a year, a sign inflation pressures remain modest even though the economy appeared to pick up steam last year.
The producer-price index, a measure of the prices businesses fetched for their goods and services, fell 0.1% in December from a month earlier, the Labor Department said Thursday. That marked the first decline since August 2016.
Prices fell broadly, particularly for services in industries like airline travel and apparel. Excluding volatile food and energy categories, so-called core prices also fell 0.1%.
Economists surveyed by The Wall Street Journal had expected both overall and core prices to climb 0.2% last month.
Economists track producer prices for early signs of where consumer prices—the main gauge of inflation—are headed. Inflation has been modest throughout much of the expansion, though there have been recent signs of a pickup. The economy grew at an above 3% annual rate in the second and third quarters of last year, faster than the overall trend of roughly 2% during the current economic expansion.
Typically, stronger economic growth leads to higher prices, but inflation has been weaker than expected in recent years for reasons economists are debating.
Some economists said they believe December’s decline reflected temporary factors, such as retailers offering discounts during the holiday season, and that underlying trends continue to point to firmer inflation.
Over a broader period, producer prices have risen. Producer prices rose 2.6% in December compared with a year earlier, the largest calendar-year increase since 2011. Core prices climbed 2.3% last year.
“The core data continue to show a sizable net pick-up in the past year,” economist Jim O’Sullivan of High Frequency Economics said in a note to clients.
The Labor Department said the December decline in prices owed largely to lower prices for services, including for car fuels, airline travel and apparel retailing.
China is issuing long-term visas to lure highly skilled people from abroad to work in the country.
The multi-entry visas will be valid for between five and 10 years, according to state media.
Technology leaders, entrepreneurs and scientists from in-demand sectors are among those eligible to apply.
China has set out goals for its economic and social development, and sees recruiting experts from abroad as key to achieving that.
When plans for the scheme were first considered, China said at least 50,000 foreigners would benefit.
Nobel Prize winners welcome
Applications for the visas can be made online, are free of charge and will be processed quickly, the Chinese government said.
Visa holders will be allowed to remain in the country for up to 180 days at a time, and will be eligible to bring partners and children.
In 2016 China introduced a ranking system for expatriates, aimed at identifying the skills it wanted to attract while reducing the number of lower-skilled foreigners coming into the country.
According to a document from the Chinese government, those classed as "high-end foreign talent" included Nobel Prize winners, successful Olympic athletes and directors of "world famous colleges of music fine arts and arts".
Top scientists, heads of major financial institutions and professors of "overseas high-level universities" also fit the bill.
[caption id="attachment_365" align="aligncenter" width="660"] Only iPhones and Macs running the very latest operating system software are safe from the Meltdown bug[/caption]
Apple has said that all iPhones, iPads and Mac computers are affected by two major flaws in computer chips.
It emerged this week
The Meltdown and Spectre flaws are found in many modern computer processing units - or microchips - made by Intel and ARM, and together the firms supply almost the entire global computer market.
Meltdown and Spectre: How chip hacks work
Computer chip scare: What home users need to know
"All Mac systems and iOS devices are affected, but there are no known exploits impacting customers at this time," Apple said in blog post on the issue.
"These issues apply to all modern processors and affect nearly all computing devices and operating systems."
Apple said it had already released "mitigations" against Meltdown in its latest iPhones and iPad operating system update - iOS 11.2 and the macOS 10.13.2 for its MacBooks and iMacs.
Meltdown does not affect the Apple Watch, it said.
Patches against Spectre, in the form of an update to web browser Safari, will be released "in the coming days".
Google and Microsoft have already issued statements telling users which products are affected by the bugs. Google said its Android phones - which make up more than 80% of the global market - were protected if users had the latest security updates.
And Microsoft has already released fixes for many of its services.
Windows users should be aware that third-party anti-virus software may need to be updated before applying operating system patches.
Security researcher Kevin Beaumont is maintaining an online list of anti-virus products that have been updated.
Guidance from US cyber-security project CERT, which is funded by the federal government, originally advised computer users that in order to fully remove the vulnerability they would have to "replace" processor hardware.
It has now changed that advice to say users should "apply updates" to mitigate any attacks instead.
Stock sold off
As the severity of the microchip flaws affecting billions of devices became clear, news broke that Intel's chief executive Brian Krzanich sold off 245,000 of his shares in the firm in October.
This was at a time when Intel knew about Meltdown and Spectre, but before the issues had become public.
"Brian's sale is unrelated," said Intel in a statement.
"It was made pursuant to a pre-arranged stock sale plan [...] with an automated sale schedule."
that tech companies have been racing to fix the Meltdown and Spectre bugs, that could allow hackers to steal data.
Billions of PCs, smartphones and tablets around the world are affected - Apple has now confirmed its products are too.
The firm has released some patches to mitigate the Meltdown flaw.
It said there was no evidence that either vulnerability had been exploited yet, but advised downloading software only from trusted sources to avoid "malicious" apps.
Mac users have often believed that their devices and operating systems are less vulnerable to security issues than, for example Android phones or computers running Microsoft systems.
By Natalie Sherman Business reporter, New York
[caption id="attachment_360" align="aligncenter" width="660"] Manufacturing, construction and health care were among the sectors to see job gains[/caption]
US employers added fewer jobs than expected in December, capping a year of slowing jobs growth.
Non-farm payrolls rose by 148,000 last month, amid losses in the retail sector, the Labor Department said.
But the unemployment rate held steady at 4.1%, the lowest it has been since 2000.
Analysts say the tightening labour market, which makes it harder to hire, is driving a broader slowdown in job creation.
The US has experienced years of economic expansion, which has boosted economic growth above 3% in recent quarters and produced annual job gains exceeding 2 million for the past seven years.
The gains are making inroads among parts of the workforce that have been slower to benefit from the economic recovery.
Among black workers, for example, the unemployment rate fell to 6.8% last month - the lowest since at least 1972, when Labor Department data starts.
Nationally, the unemployment rate has hovered at 4.1% since October, a rate not seen since 2000.
Economists have been puzzled that the lower rates have not produced stronger wage growth in recent years.
Annual wages growth crept up from 2.4% in November to 2.5% as average hourly earnings rose by nine cents. That is similar to rates in previous months.
[caption id="attachment_361" align="aligncenter" width="624"] Macy's has been closing stores in the face of online competition[/caption]
In December, construction and health care firms reported the strongest job gains, adding about 30,000 positions.
Employment in manufacturing - an industry President Donald Trump has targeted for growth - also grew by about 25,000.
But retailers shed 20,300 jobs, weighing down the final tally. That sector - which accounts for about a tenth of US jobs - has been battered by the growth of online shopping and shifts in spending habits.
Department stores such as Sears and Macy's closed hundreds of outlets last year - with more to come.
Efforts to adjust the figures to account for seasonal hiring may also be affecting the numbers, analysts said.
'Supply issues'
The US added 2.1 million jobs in 2017, 100,000 fewer than in 2016 and 600,000 down on the year before that.
Economists predict the number will be even lower in 2018, amid the low unemployment rate and broader changes in the US workforce, including the aging of the large Baby Boom generation, which is starting to retire.
"We're running into some supply issues and the demographics aren't favourable," said Sarah House, a Wells Fargo economist.
"If you don't have that supply, that's going to influence really how many jobs you can actually end up creating."
The labour force participation rate - the share of the population working or looking for work - has barely budged in three years.
In December it was 62.7%, about 4 percentage points lower than in the 1990s when the US last experienced a similar streak of job increases.
Many people who left the workforce amid the recession have returned, counteracting other demographic shifts, said Gus Faucher, economist at PNC Bank.
But he said the pool of potential workers will not be as deep in the future.
"The slowing in job growth is completely expected," he said. "It's going to lead to slower long-run growth, but it's not going to lead to a recession."
David Milliken 5 MIN READ
LONDON (Reuters) - Britain’s economic productivity perked up in the three months to the end of September, growing at its fastest rate in more than six years, in contrast to its historically weak performance over the previous decade.
[caption id="attachment_357" align="aligncenter" width="777"] FILE PHOTO - City workers are seen at their offices in the financial district of the City of London, Britain, January 7, 2016. REUTERS/Toby Melville/File Photo[/caption]
Productivity in Britain has stagnated since the global financial crisis even more than in most other advanced economies, and has played a key role in squeezing Britons’ living standards.
Over the past 10 years productivity growth was the weakest since modern records began and appears to be the slowest since the early 1820s, when Britain was emerging from the Napoleonic wars, the Office for National Statistics said on Friday.
During the third quarter of 2017, output per hour worked grew by 0.9 percent compared with the three months before, its first rise since late 2016 and the biggest increase since the second quarter of 2011, the ONS said.
However, the upturn reflected a fall in the number of people in work over the period rather than strong economic growth, which was a lacklustre 0.4 percent.
Britain’s economy slowed last year, despite strong global growth, as the plunge in the pound that followed its 2016 vote to leave the European Union triggered higher inflation that hurt consumer spending.
The uncertainty generated by Brexit has also weighed on businesses’ willingness to invest.
UNCERTAIN OUTLOOK
Productivity dropped in the first half of 2017 as businesses hired staff faster than they increased output. Compared with a year before, third-quarter productivity was just 0.8 percent higher, less than half its pre-crisis growth rate.
Late last year Britain’s government forecasters revised down their long-run productivity forecasts to around 1 percent a year, after previous expectations for it to pick up to nearer 2 percent were repeatedly disappointed.
A weaker productivity outlook also drove the BoE’s decision in November to raise interest rates for the first time in more than a decade, as it judged the economy would struggle to grow much faster than 1.5 percent a year without creating excessive inflation.
That said, Friday’s data showed unit labour costs - a measure of how much it costs to produce a given amount of output, and a key driver of inflation - rose by the least since the second quarter of 2015, increasing 1.3 percent.
Howard Archer, an economist at forecasters EY ITEM Club, said productivity was likely to have recovered further in the final three months of 2017. Early indications suggest growth remained solid while the number of people in work fell.
But he was less positive about the longer term.
“A major risk is that prolonged uncertainty and concerns over the UK’s economic outlook ends up weighing down markedly on business investment and damages productivity,” he said.
Britain’s government has launched repeated efforts to boost productivity, and says past weakness is partly due to strong job creation, which has pushed unemployment to its lowest in more than 40 years.
ONS data also show a drag from the declining North Sea oil and gas sector, and from heavy losses in financial services after the global crisis. Low investment and inconsistent management quality also weigh on productivity, economists say.
Reuters Staff 2 MIN READ
BERLIN (Reuters) - Western European car registrations fell 5.2 percent in December which had two fewer selling days than a year earlier, leading four of the region’s five main markets including Germany and France into the red, data compiled by LMC Automotive showed.
[caption id="attachment_354" align="aligncenter" width="783"] FILE PHOTO - Vehicles are parked at a cargo terminal at Piraeus port, near Athens May 20, 2015. REUTERS/Alkis Konstantinidis[/caption]
Registrations declined to 1.03 million passenger cars from 1.09 million a year earlier, the consulting firm said on Friday. Its numbers are based on a combination of published national data and estimates for some smaller markets that have yet to report.
The seasonally adjusted annualised rate (SAAR) of Western European sales slipped 1.9 percent from November levels to 14.29 million cars, according to LMC.
Sales slumped 14.4 percent in Britain and were down 3.2 percent in Italy, 1 percent in Germany and 0.5 percent in France while Spain posted a 6.2 percent gain, LMC said.
“The selling-day effect meant most markets in the region were down year-on-year, though Spain was notable in bucking this trend,” LMC analyst Jonathon Poskitt said.
Reporting by Andreas Cremer; Editing by Douglas Busvine
Over the years I have given a lot of advice on this blog to help importers save costs on quality control inspections. It seems to be a topic of high interest to many buyers.
There is a funny thing about inspections. In many supply chains, QC is a must… and at the same time it feels like such a waste of money.
1. QC is a must…
There are two reasons for this.
First, if you give an order to an unproven manufacturer, there is a high probability that their production doesn’t come out as you expect.
There might be aesthetic/finishing issues. Many pieces might not function as needed. They might decide to use substandard materials/components. They might run the products through testing stations that are incorrectly programmed. And so on and so forth. You need to give them feedback about this ASAP so they can do course corrections!
If you wait until the whole batch is completed and packed, the factory managers will probably be unwilling to open all the boxes, check and sort all the production, do rework, and repack. Not to mention, in some instances rework is impossible and they’d have to reproduce a portion of the order for free — this is really not likely to happen.
The second reason is, you need to confirm that the quantity, the packing, the labeling, and the average product quality are up to your standard before you ship the goods out.
If you let a supplier ship the goods to you from China/Hong Kong, you will most certainly have paid 80+% of the order value. If you find issues after shipment, you no longer have real leverage… not to mention, returning defective products to China is no easy task!
In both cases (not catching issues during production, and not catching issues before shipment), the buyer pays for the consequences in shipment delays, quality issues that couldn’t be properly fixed, and a much more tense relationship with the supplier.
2. … but it is wasted money!!
All right, so you need inspections in your toolbox. In many cases they make business sense.
And, at the same time, you can’t help to wonder why you need to check what the suppliers have made [and should have checked]. QC inspections create no value (except if your customer “buys” inspection reports as part of your offer, as it makes them feel better).
In an ideal world, inspection would be done at the source, wherever possible with vision systems (by the way this will become more prevalent as artificial intelligence research progresses), and with very little human double work.
Oh, and Chinese suppliers will really have to get more reliable. With the exception of complex and custom-made equipment, buyers of Japanese or Korean products seldom send an inspector to the factory…
3. How to do QC inspections catch issues but FOR LOWER COSTS
This is where “working smarter, not harder” becomes really necessary.
We have gathered our best advice into an e-book on the SynControl website: 22 Ways To Cut Costs on Your Quality Inspections
It is an easy read. You can select and read only the approaches that make sense for your company.
Some companies have applied several pieces of advice from this e-book and reduced their QC costs by up to 80%. I can’t name any company for confidentiality reasons but you will understand how it is possible by reading this e-book.
It took us some time to make it nice and useful. Looking forward to your comments!
Cate Cadell, Shu Zhang 6 MIN READ
BEIJING (Reuters) - A decision by China’s central bank to rein in reserve funds held by payment firms could cost the industry upwards of $689 million a year, spur consolidation and alter the way Asia’s biggest tech firms move money.
Mobile payments using in-app QR or bar-codes have become ubiquitous for everything from taxis to grocery shopping and bike rental in China in recent years, with customers making 19 trillion yuan (2.16 trillion pounds) in transactions in 2016, according to iResearch.
The rapid uptake has spurred fears that mobile payment firms, without oversight, could misuse funds held while transactions between users and merchants clear.
SPONSORED
Regulations unveiled by the People’s Bank of China (PBOC) on Saturday require firms to allocate 42 to 50 percent of their total client funds in regulated interest-free reserve accounts by April, up from a current rate of 12 to 20 percent.
The move will hit services backed by Tencent Group Holdings Ltd and Alibaba Group Holding Ltd affiliate Ant Financial, which together make up over 93 percent of China’s online payments market, according to research firm Analysys International.
It’s part of a two-year government crackdown on financial risks in the country’s fast growing and loosely regulated online finance sector, aimed at limiting the activities of third-party payment services, online asset managers, micro lenders and others.
The central bank has said it will eventually raise the ratio to 100 percent but hasn’t given a timeline.
The moves will impact a major source of profit for online payment firms, particularly those that relied on the interest income for fast growth during the early boom years. “From an industry perspective, these changes will alter the economics underlying certain revenue streams,” said James Lloyd, Asia-Pacific Fintech lead at EY.
“Clearly the PBOC is increasingly considering the potential financial stability risks associated with large-scale mass-market non-traditional players.”
INTEREST INCOME
China’s e-commerce and mobile payments market has enjoyed explosive growth in recent years with Alipay and Tencent’s Tenpay each accumulating over 500 million users.
Client reserve funds are prepaid sums from buyers that are held temporarily by payment companies before they are transferred to merchants. Payment firms typically deposit them into bank accounts where they earn interest.
Interest income earned on those reserve funds accounted for 11 percent of total income for internet-based payment companies, data from Zhongtai Securities shows. The latest hike in reserves will slash more than 4.48 billion yuan ($689 million) in annual interest earnings from the industry, according to Reuters calculations, under the assumption that payment companies could have earned 3 percent annualised interest rate on those funds.
Analysts say large, diversified firms such as Ant Financial and Tencent will be able to absorb the costs, and seek to replace revenue with income from other products, including wealth management tools and micro-loans.
The move puts extra pressure on the two top firms, however, who are facing barriers at home and abroad as regulators balk at the technical and financial implications of their rapid expansion.
Ant Financial on Wednesday announced it has withdrawn a $1.2 billion acquisition bid for U.S. money transfer firm Moneygram International Inc after U.S. government panel rejected the bid over national security concerns.
Ant Financial said it was supportive of the PBOC’s move. Tencent did not respond to a request for comment.
Smaller payment firms could face consolidation as their margins slide. There are currently more than 200 companies licensed to provide such services.
Shanghai-based All In Pay Network Service, which has 1.7 million merchants, said it would adjust its business to comply with the central bank’s new policy.
“In terms of the actual impact it will have on our company, that still remains to be seen,” it said.
GREATER REGULATORY OVERSIGHT
The move will allow China’s central bank to gain more insight into capital flows within the industry as it seeks to quell financial risks associated with the massive funds now kept by third-party payment companies.
The rules on reserve funds also pave the way for the establishment of a new government-directed clearing house for third-party payment companies, which is expected to launch in June. The new entity will enable the central bank to track all online financial transaction data and the flow of funds in the industry, analysts say.
In August, the regulator instructed third-party payment firms to route all of their transactions through the centralised clearing house, in which its affiliated companies own largest stakes.
In addition to new rules on reserve funds and clearing, last week the PBOC also announced plans to cap barcode payments to as low as 500 yuan to rein in risks arising from the popular service.
“Preventing risks remains the core theme in 2018,” CITIC Securities said in a research note. “Payment giants are likely to slow down their aggressive marketing deployed in the early stages of development and pay more attention to compliance.”
Additional Reporting by SHANGHAI Newsroom; Editing by Lincoln Feast
Reuters Staff 3 MIN READ
LONDON (Reuters) - British shops suffered a fall in underlying sales in December for the fifth straight year, a survey showed on Friday, adding to evidence consumers are tightening their belts.
A sale sign is seen at dawn on the outside of the Harrods store in Knightsbridge in London, January 5, 2018. REUTERS/Toby Melville
Britons are being squeezed by slow wage growth and a jump in inflation that followed the 2016 Brexit vote, prompting many forecasters to predict a further weakening in the overall economy this year after a slowdown in 2017.
SPONSORED
Accountancy and business advisory firm BDO said its monthly High Street Sales Tracker (HSST) showed a 2.3 percent fall in like-for-like sales in December.
It said fashion sales fell 3.8 percent, while sales of homewares were up 2.5 percent.
BDO said its data reinforced reports of a last minute Christmas buying spree. It said all categories recorded year-on-year growth in the week to Dec. 24, after negative like-for-like sales in the first three weeks of December.
“With discretionary spend under pressure, shoppers have been forced to think twice before making their purchases and have shown a preference to prioritise spend on food and drink, home comforts and trips out to restaurants and bars this festive season,” Sophie Michael, BDO’s head of retail and wholesale, said.
Shoppers queue for the Boxing Day sales at Selfridges in London, Britain December 26, 2017. REUTERS/Mary Turner
A separate survey from the British Retail Consortium (BRC) showed shop prices fell by an annual 0.6 percent in December, the sharpest decline since March 2017, as retailers offered larger discounts for non-food goods.
By contrast, food price inflation picked up last month.“Many non-food retailers have been keeping prices low to stimulate spending, which will undoubtedly have come at a cost to margins,” said Mike Watkins, head of retailer and business insight at Nielsen, which conducted the BRC survey.
Department store chain Debenhams (DEB.L) issued a profit warning on Thursday after it was forced to cut prices to drive sales of Christmas gifts, illustrating the challenges facing some of Britain’s best known retailers.


 A worker loaded spools of thread in a factory in Yadkinville, N.C. PHOTO: CHUCK BURTON/ASSOCIATED PRESS[/caption]

 Only iPhones and Macs running the very latest operating system software are safe from the Meltdown bug[/caption]
 Manufacturing, construction and health care were among the sectors to see job gains[/caption]
 Macy's has been closing stores in the face of online competition[/caption]
 FILE PHOTO - City workers are seen at their offices in the financial district of the City of London, Britain, January 7, 2016. REUTERS/Toby Melville/File Photo[/caption]
 FILE PHOTO - Vehicles are parked at a cargo terminal at Piraeus port, near Athens May 20, 2015. REUTERS/Alkis Konstantinidis[/caption]